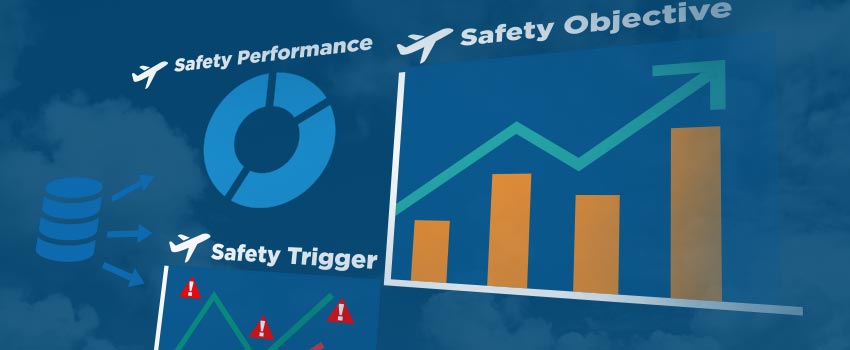
A mature safety management system will only perform effectively if safety analysis is a primary element. The objective of the safety analysis process is to extract useful information from the stored safety data and then display this information using graphs, tables, dashboards and presentations so that senior managers can make informed decisions on safety.
Imagine that your safety management system (SMS) is reaching maturity and you have established a good reporting culture within your organisation. Your airline has an effective, software-based reporting system and the number of voluntary reports has increased dramatically across all departments. Audit findings have decreased, and your airline is much safer.
Data rich, time limited information
Your safety database now contains a large number of reports which should be complete, correct and appropriately classified. This large amount of data is valid for a time limited period and it is important that you are able to determine useful safety information quickly and then present it to support data driven decision making purposes.

The process of turning safety data into useful safety information is achieved by using various statistical and technical analysis methods.
A well-developed analysis process will help organisations to:
- Refine safety objectives
- Establish effective safety performance targets
- Establish effective safety performance indicators
- Alert safety decision makers, based on safety triggers
- Establish safety presentation capabilities (e.g. safety dashboard) for ready interpretation of safety information by decision makers
- Monitor safety performance of a given department, system or process
- Highlight safety trends
- Identify factors that cause change
- Identify correlations between or among various factors
- Test assumptions
- Develop predictive modelling capabilities
Ideally, data from the safety reporting system should be combined with data from other sources such as: weather, fatigue risk management and flight data monitoring (FDM). By using information gathered from a wide variety of disparate sources, the safety analysis team will be able to determine otherwise, unforeseen trends. Furthermore, managers will have a much broader view of the safety landscape when making critical safety decisions.
A critical factor for the efficient analysis of safety data is the type of software package used. For a small airline this could be as simple as an EXCEL spreadsheet; however, larger organisations will require a more sophisticated application to cope with the increased amount of collected data; especially if many disparate data sources are utilised. Ideally, the software should be integrated with the safety reporting system and other organisational systems and processes such that it becomes part of the everyday business.
3 main analysis techniques
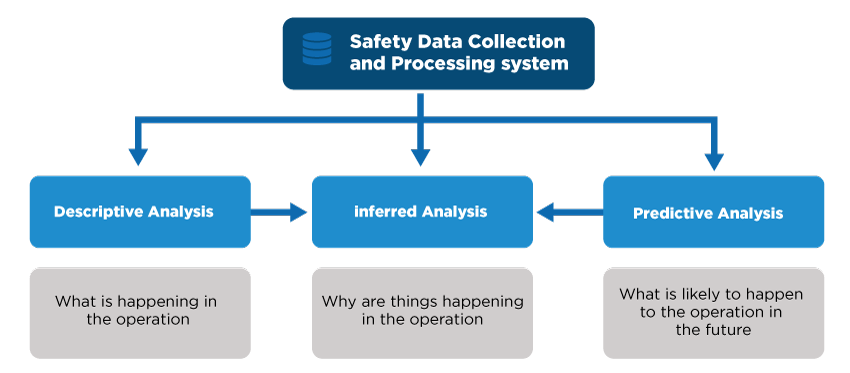
There are three broad types of analysis which can be used for examination of safety data:
- Descriptive analysis
- Inferring analysis
- Predictive analysis

Descriptive analysis is the most frequently used and describes the data and allows the safety team to present the otherwise confusing, large amounts of raw data in graphs, tables, maps or charts.
This type of analysis uses gathered information (mainly from the safety reporting system) and then applies statistical techniques to determine safety performance. For example, an organisation might be experiencing a sudden increase in the number of level busts. They could determine past performance by establishing the mean number of similar events over the previous 12 months. It could then compare current, monthly performance against the previous mean. The organisation could also use standard deviations, above and below the mean, to determine how well (or otherwise) any remedial actions are performing. Similarly, the use of standard deviations can be used to set trigger values for SPIs
Inferential analysis techniques extrapolate data taken from a small sample and apply it to the larger population. This allows the safety team to determine how observed safety performance in a small aspect of the business may affect or influence the performance across the organisation.
Furthermore, by using inferred techniques, the safety analyst can determine links and correlations between different variables. Of course, this type of analysis would require comparisons to be made not just with safety data but also other sources such as weather and geographical information. This type of analysis is best used either by large organisations or by Regulators such that they can compare trends across a small part of their jurisdiction and extrapolate them to the wider industry.
Uncovering latent issues
Finally, predictive techniques use both current and historical data to determine trends and behavior patterns in the future. This type of analysis will detect correlations between different data types and determine the likelihood of an unknown event taking place in the near future.
This is achieved by capturing relationships from variables in the past and extrapolating them to predict possible outcomes. By arming management with potential outcomes based on existing data, they can then make far better data driven, safety decisions that will enable limited resource to be allocated efficiently to areas of highest risk.
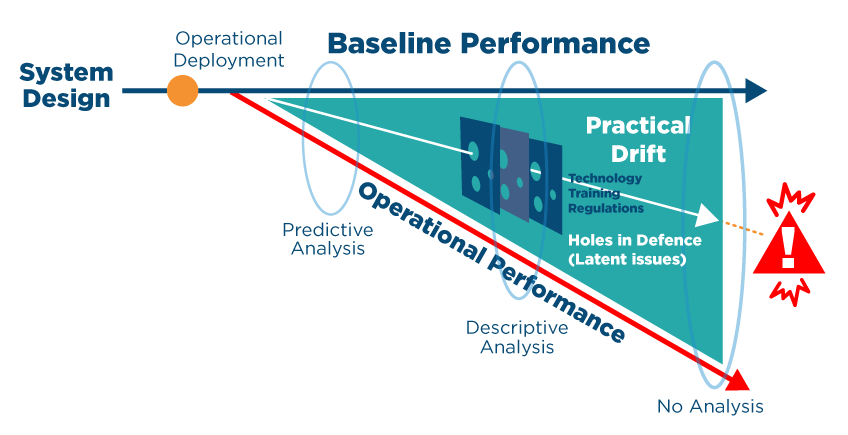
Often this type of analysis requires input from a number of different sources such as weather, crewing and FDM. Furthermore, it is the analysis of the mundane that is of most benefit. Serious events are often the result of a number of hitherto unforeseen trends that manifest suddenly as an accident. Often, these unforeseen trends are referred to as “Latent Issues”. These issues are present in the operation but can go undetected for a long time.
Latent Issues can be thought of as a bug in a piece of software that only appears when a certain set of parameters are met; sometimes with devastating effect. Latent Issues can also be the result of Practical Drift which is the gradual deterioration of performance of a system from the original design standard. The concept of practical drift (after Scott A. Snook) is shown in the diagram below:

It is only by applying statistical techniques to the large number of safety reports, coupled with other data sources, that emerging trends can be identified early. Armed with this type of information, managers can make informed safety decisions and ensure that their limited resource is apportioned appropriately to prevent these trends (and latent issues) from escalating into a serious incident.
Used correctly, effective safety data analysis will help management to:
- Identify the causes and contributing factors related to hazards and elements which are detrimental to the continuous improvement of aviation safety
- Examine areas for improvement and increase in the effectiveness of safety controls
- Improve safety performance management
- Monitor ongoing monitoring of safety performance and trends
- Make informed, data driven safety decision
Whatever methods of analysis are used, it is crucial that the results can be delivered, interpreted and acted upon easily.
Information in this article is taken from ICAO Document 9859.
Learn how the right safety management software can help support your airline’s safety investigation, risk and audit management and compliance solutions. Download our free insight to find out how to select one that benefits your airline.


